
The first time I heard about modelling and advanced statistics was when I read Isaac Asimov’s Foundation. The second time – a good 10 years later – was when I was taught about Factor Analysis by Herve de Milleville at university, and then later met Jean-Paul Benzecri, Ludovic Lebart and André Salem. My thought then was that Hari Seldon’s dream had come true. Unfortunately years of practice have put a damper on my hopes – post rationalisation made me blame Chaos Theory and as the famous adage goes: “predictions are pretty hard – especially about the future”.
I have always wanted Analyse to be a tool for exploring data and modelling – one of its first early names was “Atelier Factoriel pour Windows” hence the AFW prefix in some of the tables. The name luckily did not stick but the desire was there. So when Hervé Tranger asked me to find a way to integrate Analyse and R for his lab, I went back to the drawing board.
R is fantastically powerful and flexible – and best of all it works really well with C++, my programming language of choice. You can run C++ inside R and R inside C++. Seamless integration between the two is a bit of an exaggeration but it makes so many things possible.
The problem with the Analyse code base is that it’s dependent on lots of libraries and recompiling these inside R was not an option. Running R inside Analyse would have also meant that it would be impossible for data scientists to play around – all they could have done was run one script at a time and that would have been quickly fustrating.
We also attempted integration with AskiaApi.dll (our internal data engine) and COM but the RDCOMClient package was not very stable… and let’s face it, COM is dead. It was not murdered by Colonel Mustard in the library but by the irresistible arrival of REST APIs. At Askia, we love REST APIs – the whole of the CcaWebAPI is REST; the new Vista API is REST… but REST APIs are for web servers…
But we have another example of a stand-alone application working as a web server – and that’s Design with Jupiter… if you do not know what I am talking about, watch this video:
So we decided to use the same technology (Node.js) and write up a simple API so we could get information about the metadata and get the data.
And we were ready:
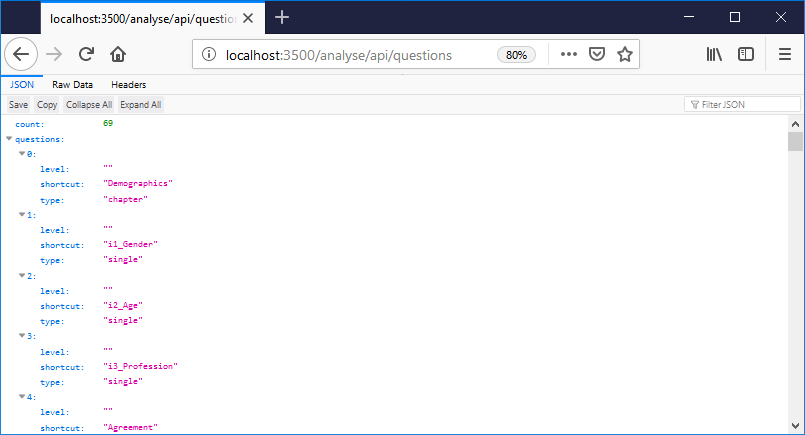
You’d call this to get the list of questions in JSON: http://localhost:3500/analyse/api/questions. This is what it looks like in a browser with a JSON parser.
This would give you the list of responses: http://localhost:3500/analyse/api/questions/i1_Gender/responses.
And this would return all the data for questions gender and age : http://localhost:3500/analyse/api/interviews?questions[]=i1_Gender&questions[]=i2_Age.
Iman, our new API specialist, drew a spec on Postman that we will update as we go along.
If you put everything together: you can already run the following script (which was originally done by our long gone intern Claire Blais) which calculates the utilities in a max-diff exercise. And now it even writes them back in a question in Analyse. MaxDiff has landed!
library(Formula)
library(miscTools)
library(lattice)
library(maxLik)
library(mlogit)
library(MASS)
library(MaxDiff)
library(httr)

#################
# Author: Claire Blais
# Date 30/08/17
#################


##################
#select the second arg, it's the number of experiments in this maxdiff analysis
##################
nbexperiments<-16

##################
#select the third arg, it's the number of screens/questions in this maxdiff analysis
##################
nbscreens<- 11

##################
#select the fourth arg, it's number of alternatives per screen in this maxdiff analysis
##################
nbalternatives<- 3

##################
#select arg five, it's the number of respondents in this maxdiff analysis
##################
#nbrespondents<-3


##################
# download your datas and modify them to call the utilities function
##################

##################
# Read the matrix from the question's responses
##################
agg.design<-read.csv("http://localhost:3500/analyse/api/questions/Matrix/responses?fields[]=caption&output=csv&excludena&noheader",header = FALSE)

##################
# Get the interview data (in the sub-level!)
##################
respondent.data<- read.csv("http://localhost:3500/analyse/api/interviews?questions[]=IntvwId&questions[]=Matrix&questions[]=Most&questions[]=Least&level=Matrix&output=csv")

agg.design=t(agg.design)
agg.design=matrix(as.numeric(agg.design),nbalternatives) # change the class

# create a vector name for your matrix

alternatives.names=c("exp1")
for(i in 2:nbexperiments)
{
	alternatives.names=c(alternatives.names,paste("exp",i,sep=""))
}
alternatives.names=data.frame(alternatives.names)

agg.design=mdAggregateToBinaryDesign(agg.design,alternatives.names) # converte to a binary table (need for next function)

rank=mdRankData(respondent.data,agg.design)

# create a vector name for your rank table
name=c("Alternative1")
for(i in 2:nbexperiments)
{
	name=c(name,paste("Alternative",i,sep=""))
}
colnames(rank)=name

#################
# calculate the mean OPTIONAL
#################
mean.individual.counts=mdMeanIndividualCounts(rank.data=rank, binary.design=agg.design)

#################
# calculate global utilities OPTIONAL
#################
logit.data=mdLogitData(rank.data=rank, binary.design=agg.design, alternatives.names=alternatives.names)

#################
# calculate the mean rank OPTIONAL
#################
mean.ranks=mdMeanRanks(rank.data=rank, binary.design=agg.design)

#################
# calculate individuals utilities IMPORTANT
#################
logit.individual.counts=mdLogitIndividualCounts(rank.data=rank, binary.design=agg.design, alternatives.names=alternatives.names)

#################
# calculate individuals utilities rank IMPORTANT
#################
logit.individual.ranks=mdLogitIndividualRanks(rank.data=rank, binary.design=agg.design, alternatives.names=alternatives.names)

# transform the matrix into a vector
utilitiesVector <- as.vector(logit.individual.counts)

##################
# Writing the data back to a calculated question called 'Utilities' (in the sub-level!)
##################
resultHttp <- PATCH("http://localhost:3500/analyse/api/questions/Utilities/interviews",
               body=paste(utilitiesVector,collapse='\n'),
               encode="form")

#################
# Job done
#################
The beauty of using a REST API to communicate with Analyse is that we have not only made an integration with R. We have done one with any modern programming language: Python, JavaScript or Haskell. And that means we will be able to integrate all the data analytics and Artificial Intelligence libraries that the best brains have put out there. Expect many new articles and new calculated question options to come in the near future… I know Iman has got a funky article coming – watch this space! And as usual, we are eagerly waiting for your suggestions, you the Askian Hari Seldons at large!