I joined Askia in January as a techie and some might say that writing a data science post when surrounded by a bunch of confirmed data science nerds is stupid. I would say it’s suicidal. So to make everyone comfortable I’d like to add that this is not a data science article but a pragmatic approach of how anyone could use data from our analyse software to create some pretty cool predictive models.
I am going to walk through a very basic example of how we used data from an online survey to create a regression predictive model on an iOS app (for offline predictions) with a few lines of code.
TL;DR => 20 lines of code to go from raw data (in your Askia survey) to an iOS app for some offline predictions of your company’s overall rating (using Machine Learning) => everything is on Github.
For the brave ones (and my family), keep reading…
Analyse API
Analyse is our desktop software for data analysis in the Market research field. In a nutshell, when people answer online surveys, on the phone or using mobile apps the data is collected and can be analysed through our software. With the new version of analyse we’d like to push this one step further as we want data scientists to play around with the data directly from their sandboxes.
Imagine you could plug your raw data to a Python script in Jupyter notebook (the playground for Python data scientists not the Jupiter we have in Design) and start playing with it within minutes without having to do any manual export. Our new Analyse API does just that. Jérôme recently wrote an article about this REST API, go read it (once you’re done with this one).
As we go deeper you’ll see that we will get remote data from our Analyse instance and manipulate it to train a regression model that we’ll then convert to an Apple CoreML model and use it within an offline mobile app to predict continuous values.
Random Forests
In our very naive (but academic) example we’ll try to predict the overall rating of a company knowing individual ratings of some of the company’s interaction points with customers (i.e Open Hours, Accessibility, Quality of the response, …). In our survey each of these aspects is being rated individually and the respondent is also asked to provide a global satisfaction rating.
Q1. Rate the open hours range => 2/10
Q2. Rate quality of response of the salesman => 0/10
Q3. Rate accessibility => 1/10
Q4. Rate the company => 10/10
Wait, what?
Even if the above example is extreme, people usually don’t provide a global rating by calculating the mean of their individual ratings. Some of the interactions with the company are more important to them than others and you may want to know what these are, how they are correlated with the overall rating and how they impact it. The more individual points of customer evaluation you have the more complex correlations might become. This is where machine learning becomes very useful. With a very simple model (and a few lines of code) you will be able to determine what combination of single points of evaluation have the most influence on your global rating. In other words, you would be able to predict which overall rating you’ll get if you could individually improve some aspects of your company.
In brief, the model will be able to predict the overall rating (Q4) if we give it the answers to Q1, Q2 and Q3
Let’s get technical (bye Mom, bye Patrick):
What we are trying to achieve is to approximate a mapping function from x (ratings for open hours, accessibility, quality of the response,… ) to y (the global rating) with y being a continuous quantity (i.e values from 0 to 10). This is also known as regression predictive modelling as opposed to classification predictive modelling that implies outputting a discrete category (i.e « dog » or « cat ») for a given input (i.e. a picture of a lovely pet).
One way to tackle a regression problem is through decision tree ensembles. Random Forest is one of these. What the heck is a decision tree you’ll say? Have a look at this beautiful (and not validated by our designer) drawing.
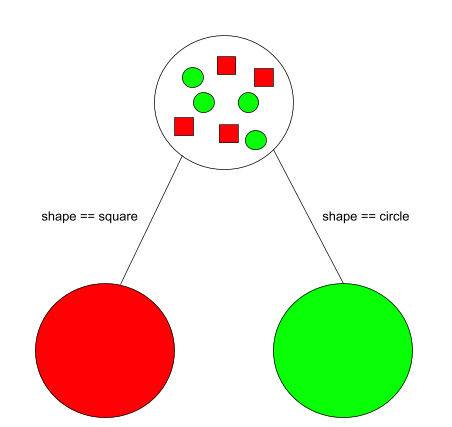
No need to be a data-scientist to get this, which by the way, I am still not. Given a dataset composed of red squares and green circles this decision tree predicts if a new item will be red or green.
If the new item is a square there is a very good chance it will be red, otherwise green. The split based on the shape aka the input (or independent variable or feature) seems natural. The colour is what we’ll trying to predict (hence the output or dependent variable).
There are two differences between this simple use case and our real-life example:
- We’ll have to deal with continuous values (not categories such as red or square) for inputs and outputs
- We have way more inputs than a single shape to deal with (all individual ratings are inputs)
The whole training process consists in letting the algorithm determine its own splits regarding the available training data we have in order to make the resulting guess more likely. It is black magic.
In our code we’ll use a Random Forest Regressor which is basically a bunch of decision trees assembled together (hence the forest). The aggregation of results from these trees is called “bagging” and will provide us with a unique prediction.
Let’s get even more technical and have a look at some Python code. The Jupyter notebook project being available on Github I won’t go into too much detail here.
dataset_url = ‘http://localhost:3500/analyse/api/interviews?questions[]=Q11.globnote&questions[]=Q11.1note …. &output=csv'

df = pd.read_csv(dataset_url, low_memory=False, verbose=True)
I’m using pandas module (pd) and the read_csv function. This returns a Data Frame (df) based on data pulled directly from a loaded survey in an Askia Analyse Instance. Pandas Data Frames are mostly the same as R DataFrames.
This data frame basically contains 3,800 interview data, each of them with 1 global rating and 14 single point ratings
After doing some data manipulation of little interest like filling in for empty values, I’m splitting the data frame into inputs and outputs
y = df['Q11.globnote'] #FIRST COLUMN (output)
X = df.drop('Q11.globnote', axis=1) #ALL OTHER COLUMNS (inputs)
and into train and test data sets using the very popular and open source machine learning python library scikit-learn
X_train, X_test, y_train, y_test = train_test_split(X, y, test_size=0.1, random_state=123, stratify=y, shuffle=True)
Note that our test data set (10% of the complete data set) helps testing our regression predictive model by evaluating its prediction skill. It is usually a good practice to evaluate a model with data it didn’t see during training stage.
The actual “training” of the random forest happens within these two lines of code. I know this is very deceptive.
m = RandomForestRegressor(n_jobs=-1)
m.fit(X_train, y_train)
RandomForestRegressor is a ready to use Random Forest algorithm provided by scikit-learn.
print "test score:"
print m.score(X_test, y_test)
print "test rmse:"
print rmse(m.predict(X_test), y_test) # Root Mean Square Error
test score:
0.9973968482941529
test rmse:
0.106390308007
iOS app you said?
And one more thing (I couldn’t resist): we can now convert this model into a CoreML model making it available to iOS apps. Yes, it will work offline as well. Apple provides a conversion library called coremltools that natively supports scikit-learn models
coreml_model = coremltools.converters.sklearn.convert(m,"Notes", "GlobalNote")
coreml_model.save('GlobalNote.mlmodel')
The model is converted and saved. It can be used inside an iOS app using Apple’s CoreML framework (iOS code is available).
  let model = GlobalNote() //an instance of my imported model

  guard let mlMultiArray = try? MLMultiArray(shape: [1,14], dataType: .double)  else {
      fatalError("Couldn't initialize multi dimensional array")
  }

  //notevalues contains single ratings values entered by the user
  for (i,v) in noteValues.enumerated() {
      mlMultiArray[i] = NSNumber(value: v)
  }

  let input = GlobalNoteInput(Notes: mlMultiArray)
  guard let globalNote = try? model.prediction(input: input) else {
      fatalError("Unexpected runtime error.")
  }
   predictionLabel.text = String(format: "%.1f", globalNote.GlobalNote)
Build and Run… Ta da!
That’s it, you can now play around with the sliders to see how these individual ratings influence you overall rating. Can you feel the black magic behind it?
Sources:
https://scikit-learn.org/stable/supervised_learning.html#supervised-learning
https://machinelearningmastery.com/classification-versus-regression-in-machine-learning/
https://victorzhou.com/blog/intro-to-random-forests/
https://apple.github.io/coremltools/generated/coremltools.converters.sklearn.convert.html#
http://course18.fast.ai/ml