
As technology has evolved, data science techniques have become more mainstream and this, in turn, has contributed to the increased value of data in industries like yours and mine. Some say it’s the new oil!
Whilst pitching their oil rigs in a sea of numbers, companies need to seek out the modern-day alchemists who can turn the regular data we all know into this black gold enthusiastically allegorised by economists and business leaders alike.
Well, you don’t need to be Paulo Coelho to know which field you will find these alchemists in: Data Science! And two of the most popular tools used by data scientists today are R and Python.
R
Statisticians and academics and have been developing R for over a quarter of a century now. R is considered to be the foremost programming language for people in these fields as it possesses a considerable catalogue of statistical and graphical methods. There are over 11,000 packages available in CRAN (open-source repository) at the time of writing. Python has a bit of catching up to do on this front. Key differences between R and other statistical software is the specialised packages for statistical computing and bespoke outputs. R comes furnished with excellent visualisation libraries to communicate the results such as ggplot2 and plotly, amongst others. And it’s open source!
Python
Python is a tool to deploy at a large-scale, especially in applications or websites. Python can approximately do the same tasks as R. It is favoured by some data scientists because of its simplicity and efficiency when it comes to big data. R is not the fastest language and can be memory intensive when dealing with large data sets. Python is therefore seen by some as more robust when it comes to performance. It is also an object-oriented language which is easier to learn, debug and maintain. And again, it’s all open source!
Here at Askia we are always looking to tap into the vast potential of such powerful tools and the communities that support them. Our savvy Askia users also cited this as one of the developments they’d like to see in our Askia Analysis software. Well in Analyse 5.5.2 these philosopher’s stones are within easy reach!
The new functionality is a jewel in the crown of Askia Analyse 5.5.2 and it’s given the title: Analyse Script Extensions – the ability for Askia Analyse to send data to, and read results from external software such as R & Python; making use of their specialised packages for statistical analysis and visualisation of data stored in .qes and .qew files.
The groundwork was laid in earnest at the beginning of 2019 when Analyse developer, Jérôme Sopoçko, my colleague and hero, used the same Node.js technology that exists in Askia Design, and implemented it in Askia Analyse. This allowed Analyse to have its own REST API so we could access information about the metadata and get the data from a .qes or .qew file. In turn, this opens up seamless integration with R, Python and any other modern programming language. If you haven’t already read Jerome’s article on the topic, it’s highly recommended!
How it works . . .
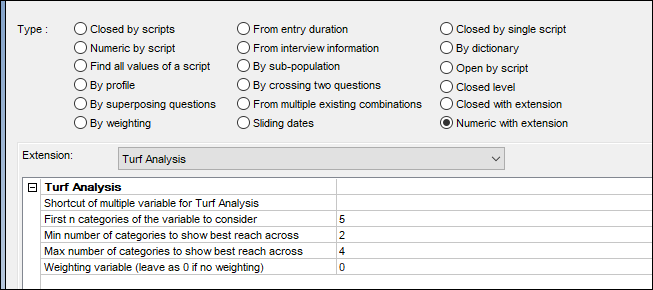
In simple terms there are two new calculated variable types in Analyse: ‘Closed with extension’ and ‘Numeric with extension’. They have the same functionality but are designed to store categorical or numeric data, respectively. We shall focus on the latter.
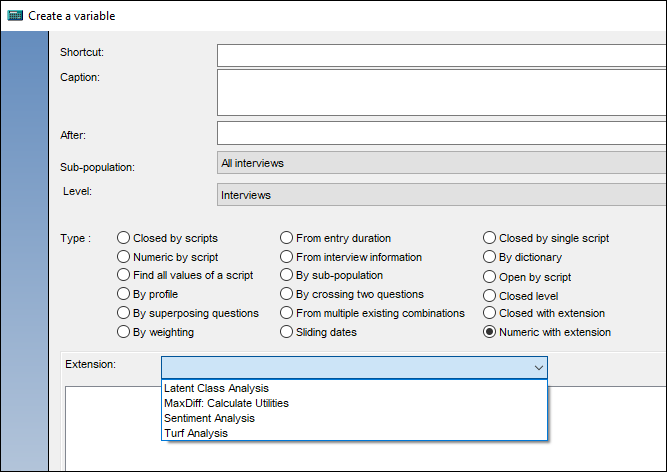
There is a list of analyses to pick from for the variable. The list is populated by looking for an XML definition file in your script extensions directory. I’ll come back to the contents of these XMLs in a moment.
The sub-directories contain the script files which tell the external software what to do (Python script files ‘.py‘ and R script files ‘.R‘).
Special thanks go out to our current intern and adept computer scientist, Léna Sasal, who has developed the R & Python scripts for Latent Class Analysis, Sentiment Analysis and Turf Analysis, and been invaluable in the whole integration process!
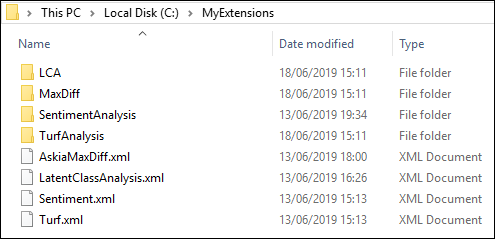
When the new version of Analyse is installed, the existing scripts and XMLs we have developed will be saved in C:\ProgramData\Askia\AnalyseExtensions. However, users can also develop their own scripts and XMLs. By simply dropping these into the extensions folder, they will be added to the list seen in the calculated variable.
We can think of this in the same way as a user developing an ADC (Askia Design Control) and dropping it into their ADC library for use in their survey.
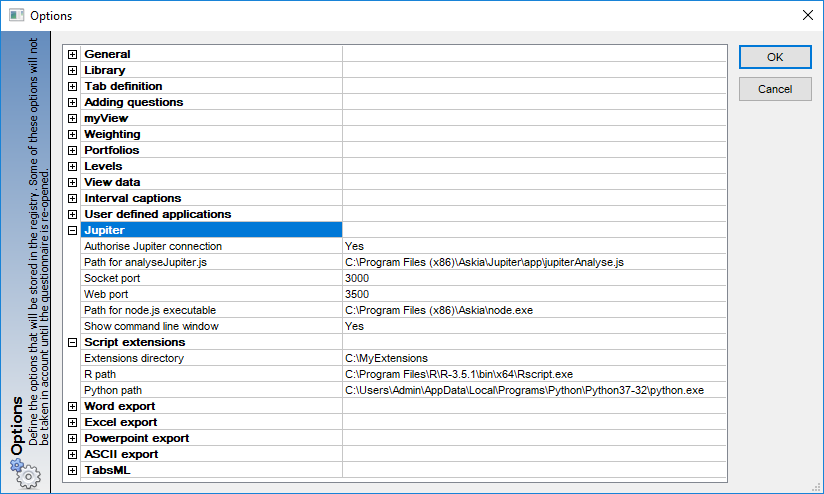
As mentioned, Analyse now has an API implemented and can be used once the correct ‘Jupiter’ settings are entered in your Analyse options shown above. This is key because it allows the data from within your .qes or .qew file to be sent to and received from an external application through http communication.
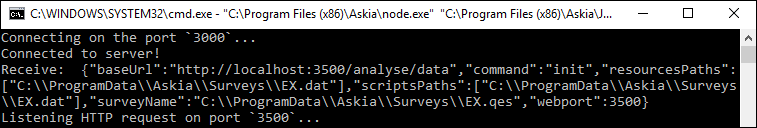
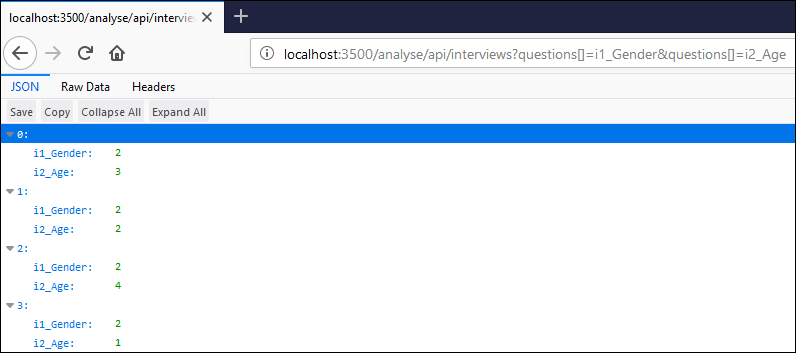
For example, below, I’m sending the data for two questions, i1_Gender & i2_Age from my .qes file to a web browser using the API call: http://localhost:3500/analyse/api/interviews?questions[]=i1_Gender&questions[]=i2_Age
When you run an analysis in R or Python, it can be triggered from the command line. The generic format of the command line roughly followed is as below:

- Path to application – this is set in your Analyse options (R path / Python path / or other executable )
- Path to your script file – this is the generic ‘Extensions directory’ set in your Analyse options followed by the sub-directory name and script filename within it
- Analysis specific parameters – these can be things such as
- the name(s) of variable(s) storing the data you want to analyse
- number of classes or categories for the analysis to return
- Generic parameters – these can be things such as
- the current question, when the analysis is writing back to the calculated variable you are creating
- the output directory, e.g. if you’re outputting to a CSV rather than to the calculated variable. Currently the output directory is the .dat folder for the data file worked on – the R or Python script will append the filename to the output directory.
e.g. for Turf Analysis:
“C:\Program Files\R\R-3.5.1\bin\x64\Rscript.exe” “C:/Users/lena/AnalyseExtensions/TurfAnalysis/Turf.R” “Where” 5 2 4 “C:\Users\Admin\Desktop\lena\~Surveys~\BeerSurveyWithComments.dat\Turf2019-06-14_10-45-03.csv” “localhost:3500” “Wgt1Var”
The XML file here is crucial. Its aim is twofold:
- To create a menu in the calculated variable where you can enter your analysis specific parameters
- To generate the command line syntax, on-the fly, when saving your calculated variable so it is interpreted and processed by the external application
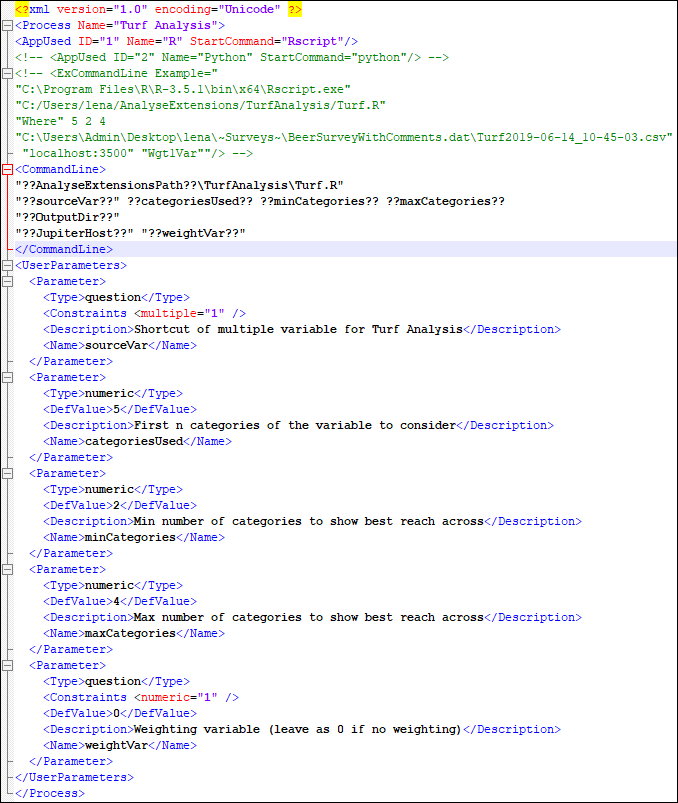
The ‘user specific parameters’ need to be defined for each analysis in the <UserParameters> section of the xml
- Analyse will check this section of the XML and create a row for each <Parameter> tag allowing you to enter question shortcuts or various numeric parameters in the calculated variable interface.
- Analyse will check the <CommandLine> section of the XML substituting the settings, generic and analysis specific parameters to create the command line which will be used by R or Python to run the analysis.
Another XML example is shown here.
What you need to use this functionality?
- Some basic experience of R or Python is almost essential for the initial set-up. We’ll improve that soon
- Install Askia Analyse 5.5.2 or higher.
- Install latest versions of R and Python (currently R 3.6.0 & Python 3.7.3)
- For R (64 bit recommended), install Java 64 bit.
- For R, install latest AskiaPackage_X.0.zip (contains functions used by the R scripts) and the packages for the Analyses run in R. They can be downloaded here.
- Set your Jupiter & Script extension settings in Analyse options.
- Ensure your script extension path contains the XML files as well as the sub-directories named appropriately and containing your R or Python script files.
Keep your eyes peeled for a follow-on blog post about Analyse 5.5.2 which will introduce another huge and exiting functionality: Automation scripts. Scripts which allow you to create portfolios automatically and much more! No prizes for guessing the title of this second blog post: Jewels in the Crown (pt 2)!

