
Maxdiff (short for Maximum Difference Scaling) is a methodology used to understand the relative importance or appeal amongst a list of features/statements. The technique is also known as “best-worst scaling”.
Based on the choice modelling technique developed by Jordan Louviere and popularised by Steven H.Cohen, the method provides preference/importance scores for brands, images, product features, advertising claims, services, etc.). Respondents are asked to compare sets of a few features, attributes or statements, and select which of these are the most and the least appealing/important to them. The technique is often used to force differentiation, when simple scales may not work as well (e.g. consumers thinking all attributes are important). Additionally, respondents can differ in the way they interpret and respond to scale questions, depending on the culture they come from.
Why is Maxdiff is so popular?
Firstly, there are a number of benefits:
- It’s an efficient way to evaluate a large set of items, compared to surveys with multiple rating scales.
- You can easily identify the relative importance of items when respondents are faced with trade-offs.
- It is easy to understand and could be used whatever the product or service being researched.
- It provides additional depth to the research by providing relative strengths and weaknesses of different products and service offerings.
- It helps you make better decisions with greater accuracy than traditional rating scales.
Additionally, it is easy to implement with Askia 😉
- The interactive library functionality in AskiaDesign makes it easy to create a Maxdiff.
- And with AskiaAnalyse, your key results can be available in a couple of clicks.
How to set-up a Maxdiff . . .
We want to ask respondents to evaluate a list of multiple items/attributes (>3) and get them to select the most important (preferred) and the worst item for them.
We iterate this to have the whole list of items displayed group by group, normally with 4 or 5 items per screen.
In this way you will have a greater discrimination between the items and a good randomisation of screens/items across the respondents, which we prefer 😉. In AskiaDesign, it’s easy to achieve this if you use our MaxDiff interactive module. But you can also create your list of items and set your own combinations of items per screen manually. For more details and examples, please see our previous Maxdiff blog or our Maxdiff support centre articles.
How to analyse Maxdiff data . . .
The aim of Maxdiff analysis is to see if we have a maximum difference when evaluating each item for “most” or “least preferred” and to calculate the preference share for each product/service.
A first approach will be to rank your items based on the percentage most preferred. But this approach is not always reliable as the respondent choice depends on the specific set of items offered per screen. For example, Item A could be the least preferred on Set 1, but might be the most preferred on the Set 2, depending on what other items it has been grouped with each time.
A second approach is to test if each item is preferred or not by using a Paired Preference Test. Using this test, when the test value is greater than 1.96 (at the confidence level of 95% or above), you can tell that the item is strongly preferred. But this test doesn’t explain how much the item is preferred relative to other items.
So a third approach would be to evaluate not only which item is preferred, but also the relative importance compared to all other items/attributes by calculating the preference share. Based on the “utility” (or value) provided by each item to a respondent, we can build up an importance score:
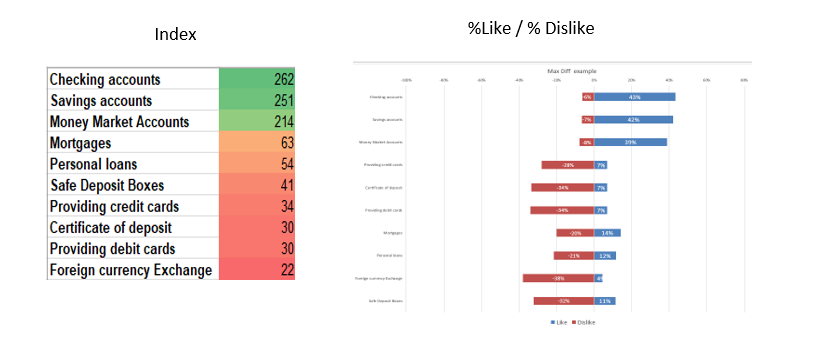
Step 1: Calculate the % of likes and % of dislikes for each item
- How many times the item has been selected as “Most” (liked) and how many times the item has been selected as “Least” (disliked), divided by the number times the items has been presented to the respondent.
Step 2: Calculate the expected utility (value) for each item
- Find the average expected utility. This is the difference between the utility when the item is liked (U_like = LN(% like / 1-% like)) and the utility when the item is disliked (U_dislike = – LN (% dislike / 1 – % dislike)).
Step 3: Scale and transform the utility for a given item
- To compare the utilities, scale them as follows: ( Ui – Average(Uall)) and transform them: Exp(Ui -Uall).
Step 4: Calculate the preference share
- Then do the ratio between each transformed utility / sum (Transformed utility).
- Then you will obtain the importance score for every item.
As a result you can do a chart profile or rank the importance score:
Based on above formulae, AskiaAnalyse offers you three methods to calculate the utilities and the preference share:-
- Using a tab setting template
- Using a calculated variable by script (numeric)
- Using a calculated variable by extension (with R)
Better than the theory, please see our useful examples from the Askia Help Centre.