“You’re either the one who creates the automation or you’re getting automated” – Tom Preston-Werner
“The central question of 2025 will be: What are people for in a world that does not need their labor, and where only a minority are needed to guide the ‘bot-based economy?” – Stowe Boyd
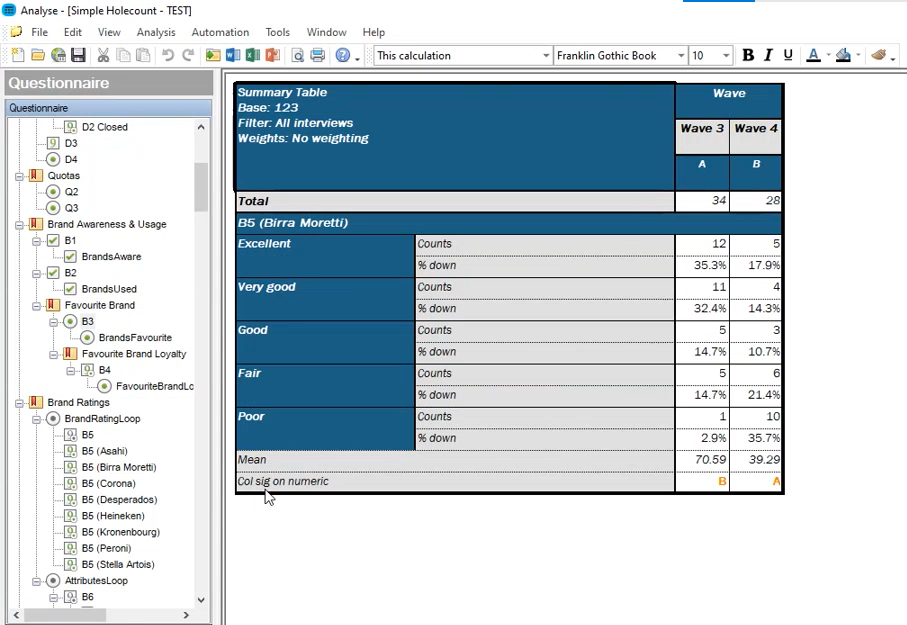
With the words of GitHub co-founder and lead researcher at Gigaom echoing in my ears, I swiftly set about using Askia Analyse’s powerful new scripting functionality to add an exciting twist to the most common deliverable in market research. In this blog article I will describe how to automatically generate a hole-count which ONLY selects questions and responses that show a significant difference after a new wave has been added in a tracker.
A typical tracker has hundreds of questions and that usually means thousands of datapoints to measure and compare wave after wave. Automation has also allowed users to increase the frequency of delivery. Some of our clients run daily waves, when quarterly was the only option a few years back. Measuring daily change for so much data is simply not possible unless it is automated.
The idea is that we produce a streamlined output. Often a full hole-count (topline report) will be produced with column significance testing between the previous and current wave to identify significant shifts in data. This involves sifting through reams of insignificant data to pick out those key, significant changes we are looking for. What better than to automatically create a table set that has only the significantly different row responses and questions shown!
I have written a new Knowledge Base article that provides an instructional walk-through of the code and formulas used: Further Automation Script Examples. I would recommend reading the first two parts of the article. The Automation scripts can be downloaded from the article and used on any file with a ‘Wave’ variable.
Can we still be more intelligent and selective when using automation to lay the foundations for the lighthouse that illuminates our sea of insights?
Generating these portfolios should be the first step when adding a new wave in Askia Surf. What we have done with the scripts shared above is simply detect change, but what is our bigger ambition and what ideas can this blog post help our school of innovative users to form? Can we still be more intelligent and selective when using automation to lay the foundations for the lighthouse that illuminates our sea of insights?
Let us be clear: we are going to show correlations. Now we all know that correlation does not show causality – remember Statistics 101 – but we also need to be aware that correlation often shows truisms which are of little use. You are more likely to do your Christmas shopping in December (around the 23rd if you are like me) than in July. And a machine that would triumphantly announce that this is the biggest insight ever will not win a prize at the next ESOMAR conference (whenever that will be). Similarly if we detect a change that shows ice cream or shorts sales have increased in summer then this can also be of little value – how can we predict where the real value lies in any data set and where the sharpest focus should fall?
The platform of the future will not only show significant differences but differences with a significance, means with a meaning!
The secret is to learn from people. We need to monitor what makes researchers tick. And learn to ignore what they disregard. For example, can we aggregate click tracking data with machine learning on a dashboard or stats software to understand how researchers use templated data and where they eventually spend their time?
The platform of the future will not only show significant differences but differences with a significance, means with a meaning! When we do this, we can turn the time required for exploring the data into more time spent on interpreting it and allowing people to dive deeper for richer insights. This is our goal and these automation scripts open the door to this as a possibility.
We are just at the start of the automation journey. Nevertheless, we can already see the power that automation brings and the hours of time that can be saved. As we add more levels of intelligence to automation we will be able to get to the key insights with even more speed and more certainty. We encourage you to download these scripts and start using them on your continuous research programs. The more we apply intelligent automation, the more we all learn and the better focused our developments can be toward this vision.
Askia Analyse’s automation scripts are just a stepping-stone on our journey. We would love to hear your innovative stories that continue us all on this exciting path!
Photo by Wolfgang Rottmann on Unsplash